Web Dashboard
Colony includes a built-in web dashboard for managing the always-on colony system. Users sign up, create sessions, map codebases, and submit analysis runs — all through the browser.
Getting Started
The dashboard starts automatically with colony-env up at localhost:8080.
- Sign up — create an account (username + password). A default workspace is created automatically.
- Map content — go to the VCM tab and click "Map Content" to clone a git repo into VCM pages.
- Create a session — click "+ New Session" in the sidebar.
- Submit a run — click "Start Run" to configure and launch analysis agents.
- Monitor — watch progress across the Overview, Agents, Traces, and Logs tabs.
Dashboard Sections
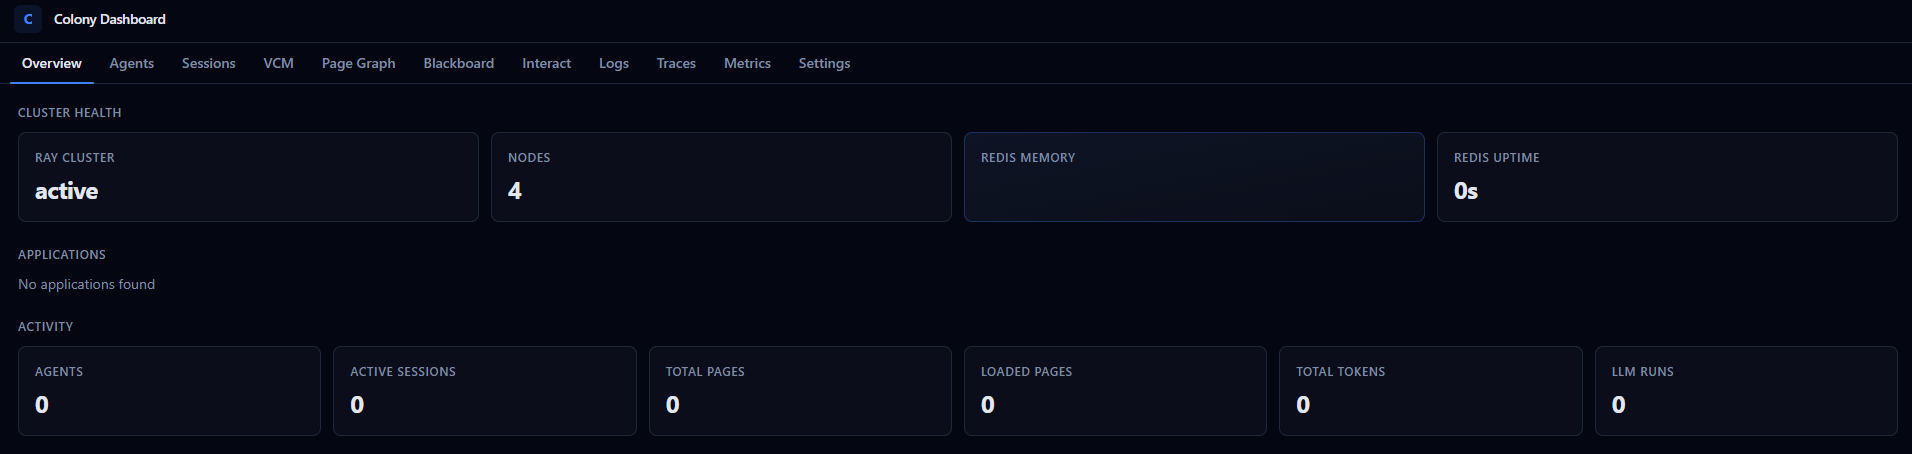
Overview
Cluster health, application deployments, and quick statistics at a glance.
Agents
Browse registered agents with:
- Current state (
RUNNING,IDLE,STOPPED) - Attached capabilities
- Action history
- Agent details and configuration
Sessions
Session history showing:
- Agent runs within each session
- Token usage per run
- Input/output history
- Intermediate events
VCM (Virtual Context Memory)
Virtual context memory statistics:
- Page table state
- Working sets per agent
- Cache hit/miss rates
- Page loading activity
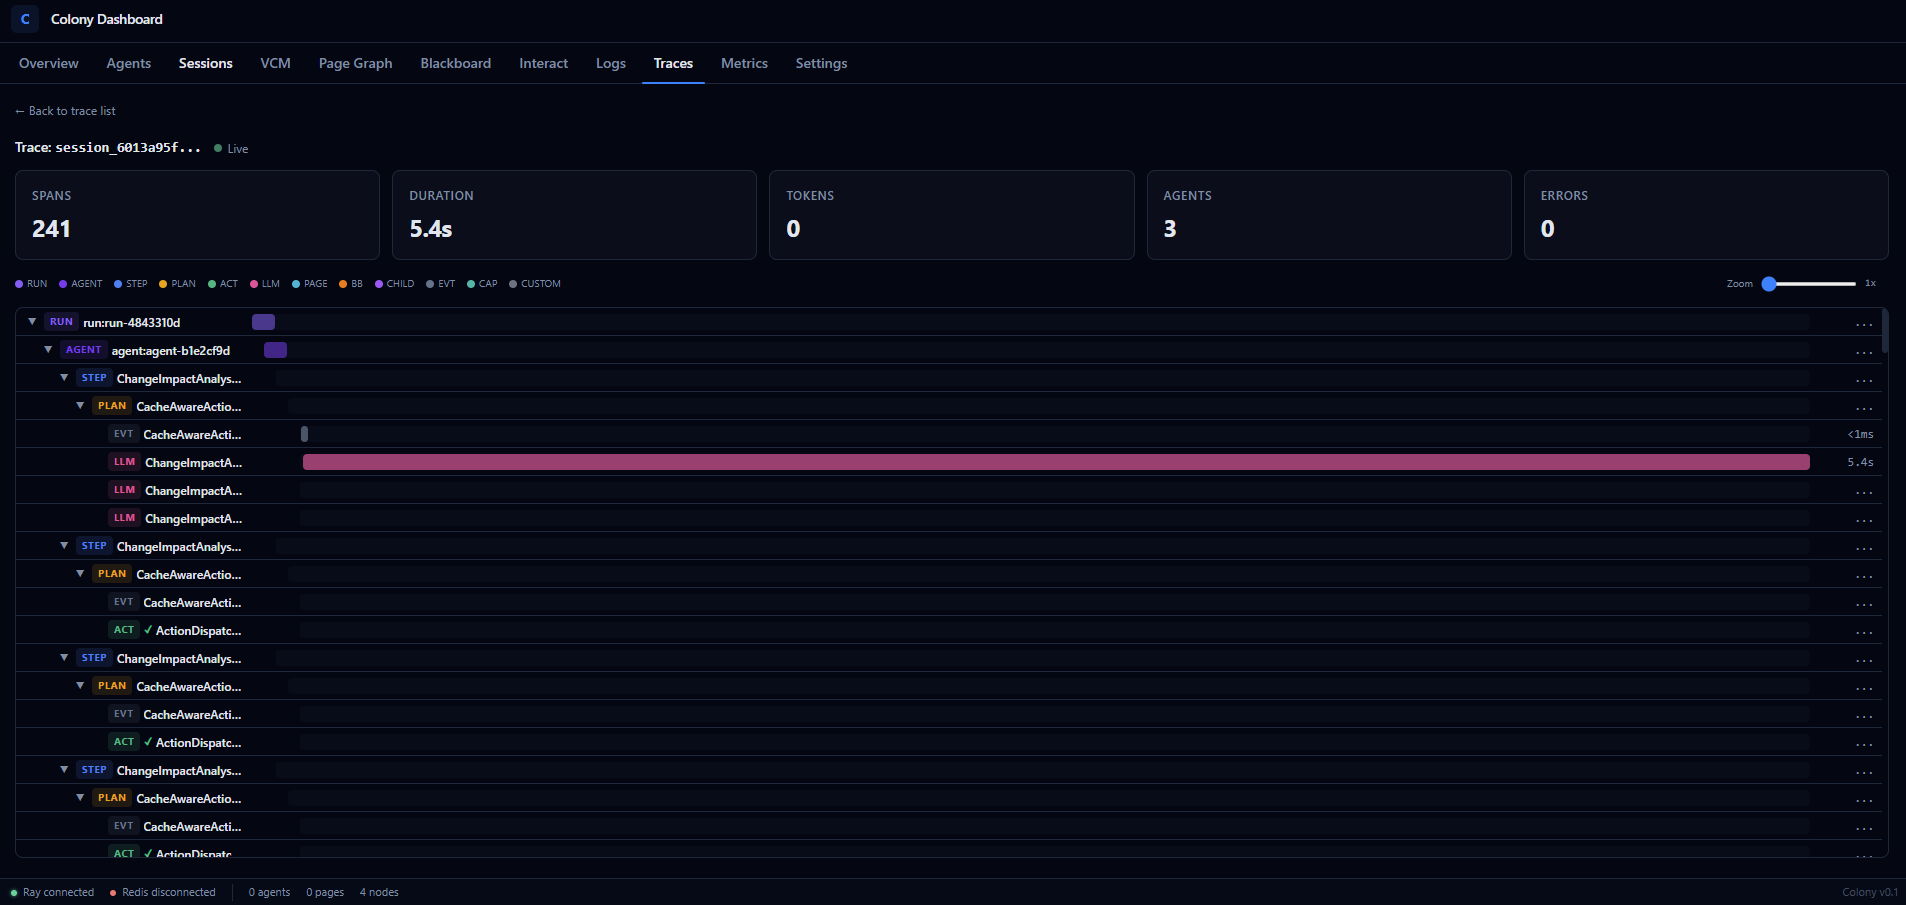
Traces and Spans
Detailed tracing of agent actions, VCM operations, and system events for debugging and performance analysis.
Add details on how to tracing on user code and custom capabilities.
Document the tracing API for user code and custom capabilities, and how those traces appear in the dashboard. Include examples of how to use it for debugging and performance analysis. See colony_docs/markdown/agents/observability_plan.md
Frontend Development
For developing the dashboard frontend with hot-reload:
cd src/polymathera/colony/web_ui/frontend
npm install
npm run dev     # Starts on localhost:5173, proxies /api to localhost:8080
The frontend is built with React, TypeScript, Tailwind CSS, and Vite. The backend is FastAPI.
API
The dashboard backend exposes a REST API at /api/v1/. All endpoints except auth and infrastructure require authentication (JWT cookie).
Auth:
POST /api/v1/auth/signup— Create accountPOST /api/v1/auth/login— Log inPOST /api/v1/auth/logout— Log outGET /api/v1/auth/me— Current user info
Sessions & Jobs:
POST /api/v1/sessions/— Create sessionGET /api/v1/sessions/— List sessionsPOST /api/v1/jobs/submit— Submit analysis jobGET /api/v1/jobs/{id}— Job status
VCM:
POST /api/v1/vcm/map— Map a repository to VCMGET /api/v1/vcm/map/operations— Mapping progressGET /api/v1/vcm/pages— Page table
Agents:
GET /api/v1/agents/— List agentsPOST /api/v1/agents/spawn— Spawn agentPOST /api/v1/agents/{id}/interrupt— Stop agent